AD = C + I + G + Xn
Shows the demand by consumers, businesses, government, and foreign countries.
Changes in price level cause a move along the curve.
Why does AD downward slope?
Real-Balance Effect
Higher price levels reduce the purchasing power of money.
This decreases the quantity of expenditures.
Lower price levels increase purchasing power and expenditures.
Interest-Rate Effect
When the price level increases, lenders need to charge higher interest rates to get a REAL return on their loans.
Higher interest rates discourage consumer spending and business investment.
Foreign Trade Effect
When U.S. price level rises, foreign buyers purchase fewer U.S. goods and Americans buy more foreign goods.
Exports fall and imports rise causing real GDP demanded to fall (Xn decreases).
Shifters of Aggregate Demand
GDP = C + I + G + Xn
Two parts to a shift in AD:
A change in C, Ig, G, and/or Xn.
A multiplier effect that produces a greater change than the original change in the 4 components.
Increase in AD = AD >
Decrease in AD = AD <
Consumption:
Household spending is affected by:
Consumer wealth ( ^ wealth, ^ spending)
Consumer expectations ( ^ expectations, ^ spending)
Household indebtedness ( if debt decreases, spending ^)
Taxes (if taxes decrease, spending ^)
Gross Private Investment:
Investment spending is sensitive to:
Real Interest Rate (if interest rate decreases, investment ^)\
Expected returns ( ^ expected returns = ^ Investment)
Influenced by:
Expectations of future profit
Technology
Degree of excess capacity
Business taxes
Government Spending:
^ government spending = AD >
Decrease in government spending = AD <
Net Exports-
Sensitive to:
Exchange rates (International value of $)
Strong $ = more imports/fewer exports (AD < )
Weak $ = fewer imports/more exports (AD > )
Relative Income
Strong foreign economy = ^ exports (AD >)
Weak foreign economy = less exports ( AD < )
Aggregate Supply:
Long Run
Input prices are completely flexible and adjust to changes in the price-level.
Real GDP is independent of price-level.
Short Run
Input prices are sticky and don't adjust to a change in price-level.
Level of Real GDP is directly related to price level.
Long Run Aggregate Supply (LRAS)
Marks the level of full employment in the economy.
Because input prices are completely flexible in the long-run, changes in price-level do not change firms' real profits.
LRAS = Vertical
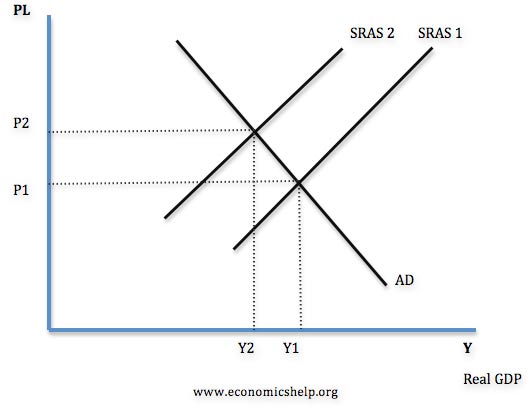
Changes in SRAS
Increase in SRAS = >
Decrease in SRAS = <
Per-Unit cost of production = total input cost / total output
Determinants of SRAS
Input prices, productivity, and legal institutional environment affect unit cost per production.
Input prices
Domestic Resource prices
Wages (75% of all business costs)
Cost of capital
Raw Materials (Commodity prices)
Foreign Resource prices
Market power
Increase in Resource prices = SRAS <
Decrease in Resource prices = SRAS >
Productivity = Total output / total input
More productivity = lower unit of production = SRAS >
Less productivity = higher unit of production = SRAS <
Legal Institutional Environment
Taxes and subsidies
Government regulation
Cost of compliance = SRAS <
Reregulation = SRAS >
Full Employment
FE Equilibrium exists where AD intersects SRAS and LRAS at the same time.
Recessionary Gap: When equilibrium point occurs below full employment output.
Inflationary Gap: When equilibrium point occurs beyond full employment output.
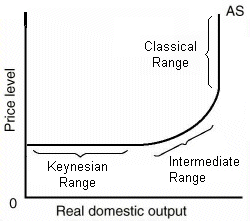
SRAS
Classical(Vertical) Range: Inflationary
Keynesian(Horizontal) Range: Recession
Nominal Wages vs. Real Wages
Nominal Wages: Amount of money received by a worker per unit of time.
Real Wages: Amount of goods/services a worker can purchase with their nominal wage.
Sticky Wages: Nominal wage level that is set according to an initial price level and does not vary due to labor contracts or other restrictions.
Recession(Keynesian Range): Fixed price and wages and flexible employment level.
Output depends upon changes in employment level.
Intermediate Range; Flexible price and employment level and fixed wages.
Output depends upon changes in price and employment level.
Inflationary Range: Flexible price and wages and fixed employment level.
Output is independent of changes in the price level.
Investment
Money spent or expenditures on new plants (factories), capital equipment (machinery), technology (hardware and software), new homes, and inventories (goods sold by producers).
Expected Rates of Return
How does business make investment decisions?
Cost/Benefit Analysis
How does business determine benefits?
Expected rate of return
How does business count the cost?
Interest costs
How does business determine the amount of investment they undertake?
If expected return > interest cost, then invest.
If expected return < interest cost, do not invest.
Real (r%) vs. Nominal (i%)
Nominal is the observable rate of interest.
Real subtracts out inflation (pi%) and is only know ex post facto.
How do you compare the real interest rate (r%)/
r% = i% - pi%
What then, determines the cost of investment decision?
Real interest rate (r%)
Investment Demand Curve (ID)
What is the shape of the Investment Demand Curve?
Downward sloping
Why?
When interest rates are high, fewer investments are profitable.
When interest rates are low, more investments are profitable.
Cost of production
Lower costs shift ID >
Higher costs shift ID <
Business taxes
Lower business taxes shift ID >
Higher business taxes shift ID <
Technological Change
New technology shifts ID >
Lack of technological change shifts ID <
Stock of capital
If an economy is low, then ID >
If capital increases, then ID <
Expectations
Positive = ID >
Negative = ID <